Weather can sometimes be an amazing thing. Take, for example, Tropical Storm Alberto that hit the Gulf Coast on May 28, 2018. Normally when a major storm or a hurricane comes out of the ocean and onto land, it may keep going for a little bit and then die out. Alberto kept on going. Two days after it made landfall, it dumped up to five inches of rain over parts of the Chicagoland area, which lead to lots of flooding.
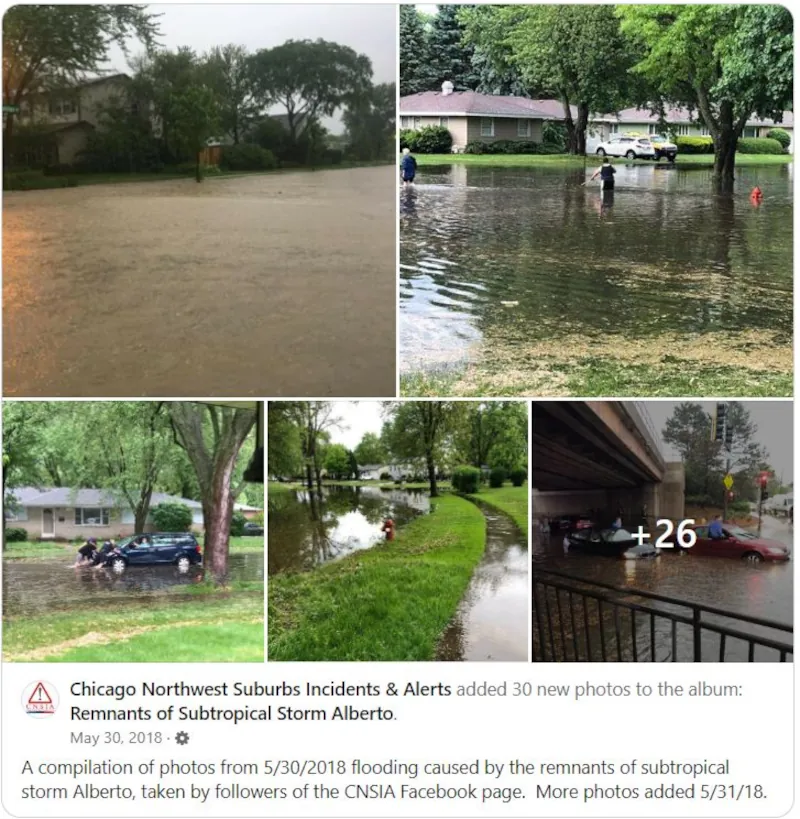
That is just a screenshot with a few pictures of flooding around the Chicagoland area. If you are on Facebook, and want to see the entire album of pictures, it can be found here:
https://www.facebook.com/media/set/?set=a.238026980288142&type=3
After Alberto passed through Chicago, it wasn’t quite done yet. I recall there being reports of remnants of Tropical Storm Alberto up into Wisconsin as well. The storm travelled over 900 miles after it made land fall before it finally petered out. That’s just incredible to me.
More recently, we’ve had two weather related events here over the past month. The smoke from the wildfires raging across Canada have had a major impact on our air quality here. On June 27th Chicago had the worst air quality among the major cities around the world. This was obviously a major concern for us because of James’ respiratory issues, but thankfully he didn’t seem to have any effects from it. We did limit his exposure outside and had him wear a mask whenever he was.
Last week we had a confirmed tornado touch down about a mile south of our house. It was a weak EF-0 tornado, but still a bit scary. I actually got stuck at work because of the tornado sirens. I had literally just opened the door to leave work when the sirens went off. I stood there for a few seconds debating if I should risk it and drive home, or if I should head to the basement. I chose the latter. After about thirty minutes we got the “all clear” so I booked it out of there to head home. I was less than 5 minutes from home when the tornado sirens went off again. I got home and we all hunkered down in the only part of our house without any windows—the hallway to the bedrooms and the hallway bathroom.

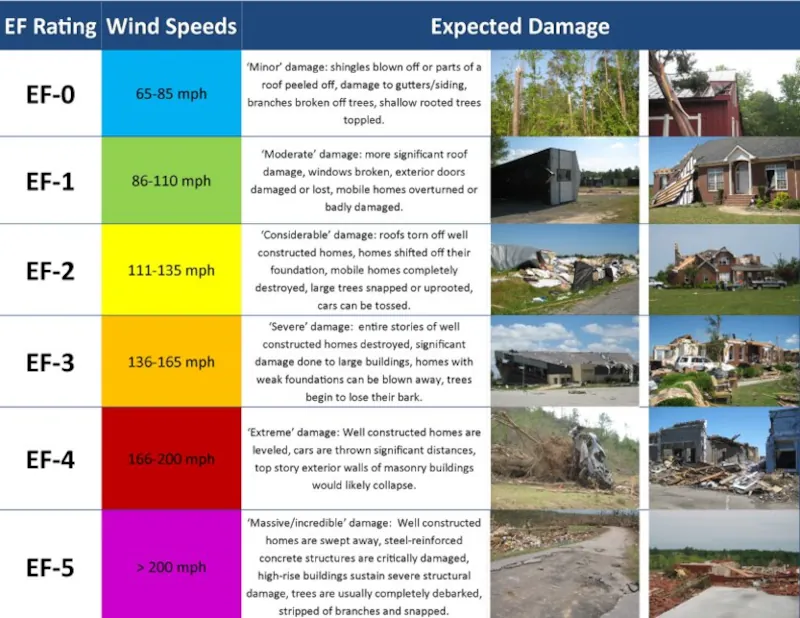
It took them a couple of days, but the National Weather Service confirmed a total of 13 tornados in the Chicagoland area. Ten of them (including ours) were rated EF-0, and the other three were rated EF-1. All of them were lower on the EF Scale. I don’t know about the other areas, but our tornado just caused some minor tree damage along its path. If you’re curious about the EF Scale ratings, I am including a chart here from the National Weather Service.